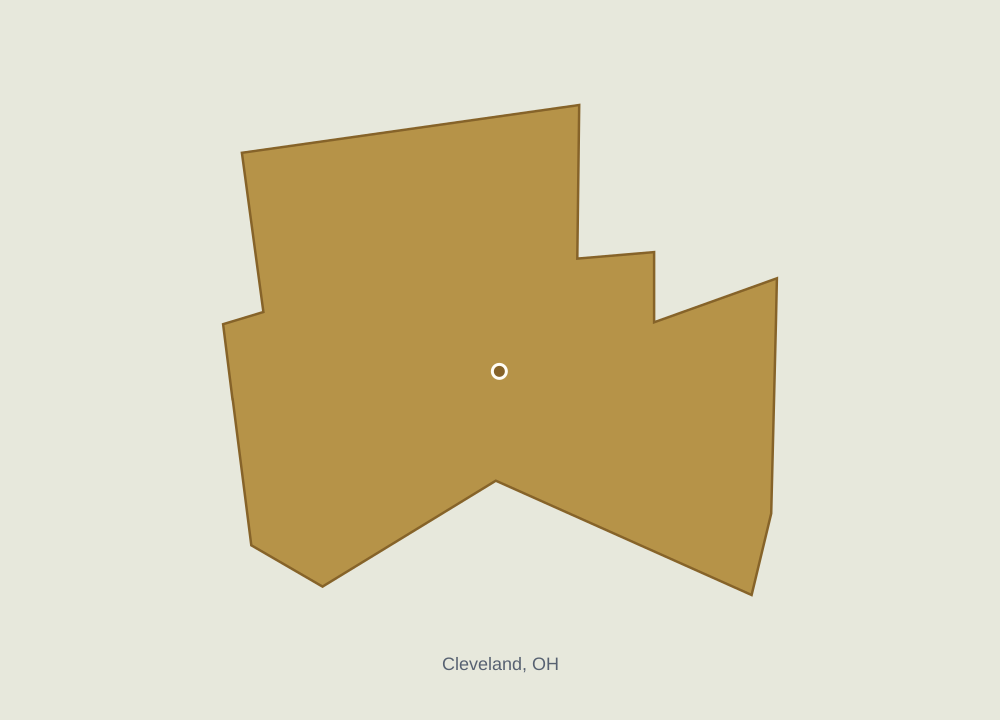
ZIP code 44106 serves Cleveland, Ohio, in Cuyahoga County. About 25,000 people call this midsize urban ZIP area home. It is within Cleveland, one of the country's major cities. It is part of the Cleveland, OH Metro Area. Residents commute an average of 22 minutes, and median household income is around $43,000. Temperatures average 56°F over the year. The cost of living index is 95, with 100 representing the national benchmark. Healthcare and premium retail are generally within easy reach.
Compare 44106 with another ZIP anywhere in the United States.
US & Ohio percentiles?p90 means the value is higher than 90% of ZIPs. A higher percentile is not always better, for example for housing costs.
Attribute44106 Cleveland, OH
No matching attributes. Try another search.
Geography
31 available⌄
Population?Total population estimate.
25,120
USp85
Ohiop88
Not available
US
Population Density?Population density (people per square mile).
5,844.6
USp95
Ohiop98
Not available
US
Metro Area?Metropolitan statistical area (MSA) containing the ZIP's representative point.
Cleveland, OH
US
Ohio
Not available
US
Nearest Major City (mi)?Tract-weighted distance to the nearest estimated 100k+ population Census place internal point; 0 for tracts inside one.
1.6 mi
USp10
Ohiop8
Not available
US
Land Area (sq mi)?Land area in square miles.
4.3
USp18
Ohiop27
Not available
US
Urbanicity25 attributes
Neighborhood?Census community (CDP) covering most of the ZIP, else the USPS locale name when it names an area rather than a delivery facility.
Not available
US
Ohio
Not available
US
Postal Place?USPS ZIP Locale Detail locale name, often a post office or delivery facility.
B Station Cleveland
US
Ohio
Not available
US
Containing Place Population?Estimated population of the primary Census place containing the area, computed from tract/place overlaps.
269,360
US
Ohio
Not available
US
Dominant Tract Class?Dominant tract urbanicity class after applying the area's tract composition weights. Uses density, developed footprint, city boundaries, and proximity to major cities or regional metro centers. City cores are urban, developed surrounding neighborhoods suburban, lower-density fringes exurban, and isolated settlements small towns.✦ SkaldMaps insight
Urban
US
Ohio
Not available
US
Urbanicity Score?Rural-to-urban score from 0 to 100 derived from tract density, place/city context, metro context, Census urban-area coverage, and HUD diagnostics.✦ SkaldMaps insight
Urbanicity Class Code?Urbanicity class code derived from tract composition: 0 rural/open, 1 exurban or small town, 2 suburban or business/industrial, 3 urban.✦ SkaldMaps insight
Urban (3 of 3)
USp89
Ohiop91
Not available
US
Nearest Major City?Name of the nearest estimated 100k+ population Census place, or the containing one for ZIPs inside a major city.
Cleveland, OH
US
Ohio
Not available
US
Nearest Major Metro?Center (largest principal city) of the nearest MSA with 500,000+ people, e.g. Indianapolis for Indianapolis-Carmel-Greenwood, IN.
Cleveland, OH
US
Ohio
Not available
US
Nearest Major Metro (mi)?Straight-line miles from the ZIP point to the center of the nearest MSA with 500,000+ people.
4.3 mi
USp3
Ohiop6
Not available
US
In Metro Area?1 when the area's tract-weighted composition is mostly inside Census core-based statistical areas, otherwise 0.
Yes
US
Ohio
Not available
US
In 100k+ City?1 when the area's tract-weighted composition is mostly inside estimated 100k+ population Census places, otherwise 0.
Yes
US
Ohio
Not available
US
In Census Urban Area?1 when at least half of the area's tract-weighted composition overlaps Census urban areas, otherwise 0.
Yes
US
Ohio
Not available
US
Census Urban Area Coverage?Tract-weighted share of the area covered by Census 2020 urban areas.✦ SkaldMaps insight
100.0%
USp95
Ohiop94
Not available
US
Rural/Open Flag?1 when the area classifies as rural/open, otherwise 0. See Urbanicity score.✦ SkaldMaps insight
No
US
Ohio
Not available
US
Exurban Flag?1 when tract composition indicates low-density settlement connected to a major city or regional metro center, otherwise 0. See Urbanicity score.✦ SkaldMaps insight
No
US
Ohio
Not available
US
Small Town Flag?1 when tract composition indicates a settled place outside city and regional metro reach, otherwise 0. See Urbanicity score.✦ SkaldMaps insight
No
US
Ohio
Not available
US
Suburban Flag?1 when tract composition indicates developed suburbs around a major city or regional metro center, or business/industrial areas, otherwise 0. See Urbanicity score.✦ SkaldMaps insight
No
US
Ohio
Not available
US
Urban Flag?1 when the area classifies as urban from tract composition, otherwise 0. See Urbanicity score.✦ SkaldMaps insight
Yes
US
Ohio
Not available
US
Rural/Open Tract Share?Share of the area's tract-weighted composition classified as rural/open.✦ SkaldMaps insight
0.0%
USp0
Ohiop0
Not available
US
Exurban Tract Share?Share of the area's tract-weighted composition classified as exurban.✦ SkaldMaps insight
0.0%
USp0
Ohiop0
Not available
US
Small Town Tract Share?Share of the area's tract-weighted composition classified as small town.✦ SkaldMaps insight
0.0%
USp0
Ohiop0
Not available
US
Suburban Tract Share?Share of the area's tract-weighted composition classified as suburban.✦ SkaldMaps insight
21.2%
USp77
Ohiop71
Not available
US
Urban Tract Share?Share of the area's tract-weighted composition classified as urban.✦ SkaldMaps insight
78.8%
USp94
Ohiop95
Not available
US
Business/Industrial Tract Share?Share of the area's tract-weighted composition classified as business/industrial.
0.0%
USp0
Ohiop0
Not available
US
Has Business/Industrial Tract?1 when any tract-weighted composition is classified as business/industrial, otherwise 0.
No
US
Ohio
Not available
US
Area2 attributes
Total Area (sq mi)?Total area (land + water) in square miles.
Median Mortgaged Home Value?Median owner-occupied home value among units with a mortgage.
$298,100
USp61
Ohiop86
Not available
US
Monthly owner costs · with mortgage?Median monthly owner costs for owner-occupied units with a mortgage.
$2,005
USp74
Ohiop93
Not available
US
Median Real Estate Taxes?Median real estate taxes for owner-occupied units with a mortgage.
$7,786
USp93
Ohiop99
Not available
US
Two-bedroom rent benchmark?HUD Small Area Fair Market Rent benchmark for a two-bedroom unit, with county FMR fallback when small-area rent is unavailable.
$1,279
USp59
Ohiop78
Not available
US
Public Affordability Index?Median household income divided by required income for median owner costs; values above 1 indicate better public-source affordability.✦ SkaldMaps insight
0.5
USp1
Ohiop1
Not available
US
Home value / household income?Median mortgaged owner home value divided by median household income.
6.9
USp92
Ohiop99
Not available
US
Ownership Costs5 attributes
Cost-Burdened Mortgaged Units?Estimated owner-occupied mortgaged units spending at least 30% of income on monthly housing costs.
421
USp72
Ohiop73
Not available
US
Housing cost-burdened households?HUD CHAS share of occupied households with housing cost burden at the selected geography; lower levels use documented HUD/crosswalk allocation where needed.
HUD CHAS Severe Cost Burden?HUD CHAS share of occupied households with severe housing cost burden at the selected geography; lower levels use documented HUD/crosswalk allocation where needed.
14.2%
USp79
Ohiop95
Not available
US
Mortgage Cost-Burdened Share?Share of owner-occupied mortgaged units spending at least 30% of income on monthly housing costs.
34.5%
USp76
Ohiop90
Not available
US
Ownership Analysis8 attributes
Gross Rent / Value Proxy?Annual HUD 2-bedroom SAFMR divided by median mortgaged owner home value.
Average Sale Price?Average recent sale price from multiple market sources. Requires at least two sources. The latest figure may be revised as more sales are reported.
Not available
US
Ohio
Not available
US
Average Listing Price?Average asking price across available market sources. Requires at least two sources; the source count shows how many were used.
$309,780
USp35
Ohiop62
Not available
US
Average Homes for Sale?Average number of homes for sale across available market sources. Requires at least two sources; the source count shows how many were used.
74
USp77
Ohiop86
Not available
US
Skald Buyer Negotiation Score?How favorable current conditions are for buyers. Higher means more room to negotiate.✦ SkaldMaps insight
Buyer Cost-of-Living Index?Relative cost of living for a homebuyer, combining local prices and homeownership costs. 100 is about the national level.✦ SkaldMaps insight
94.9
USp44
Ohiop74
Not available
US
Prices2 attributes
Average Listing Price per Sq Ft?Average asking price per square foot across available market sources. Requires at least two sources.
$150
USp20
Ohiop33
Not available
US
Average Listing-to-Sale Price Ratio?How the average asking price compares with the average sale price. Above 1 means asking prices are higher.
Not available
US
Ohio
Not available
US
Affordability4 attributes
Estimated Annual Ownership Cost?Estimated yearly cost to own a typical listed home, including mortgage, property tax, insurance, and maintenance.✦ SkaldMaps insight
Local Affordability Index?How local household income compares with the income needed for a typical listed home. Higher is more affordable.✦ SkaldMaps insight
Skald Market Hotness Score?Overall market momentum based on competition, speed, supply, and recent price movement. Higher means a hotter market.✦ SkaldMaps insight
School Quality Index?Outcome-only school quality index from area-weighted EDFacts district math proficiency, reading proficiency, and graduation rates.✦ SkaldMaps insight
30.9
USp12
Ohiop4
Not available
US
Math Proficiency?Area-weighted public district mathematics proficiency rate from EDFacts all-students rows.
12.9%
USp6
Ohiop3
Not available
US
Reading Proficiency?Area-weighted public district reading/language arts proficiency rate from EDFacts all-students rows.
25.8%
USp10
Ohiop4
Not available
US
Graduation Rate?Area-weighted public district graduation rate from EDFacts all-students rows.
77.3%
USp10
Ohiop8
Not available
US
School Data Coverage?Area-weighted coverage of the EDFacts metrics used by the school quality index. Higher means more overlapping district outcome data was present.
100.0%
USp49
Ohiop54
Not available
US
Public Schools?Area-weighted count of operational public schools in overlapping NCES LEAs.
69.9
USp91
Ohiop97
Not available
US
Context1 attributes
Charter School Share?Area-weighted share of operational public schools flagged as charter schools in overlapping NCES LEAs.
1-Year Home Price Appreciation?One-year public home price index appreciation from the latest available annual index. Direct ZIP5 HPI is primary; tract-weighted HPI is retained for fallback and audit coverage.
5-Year Home Price Appreciation?Five-year public home price index appreciation from the latest available annual index. Direct ZIP5 HPI is primary; tract-weighted HPI is retained for fallback and audit coverage.
Home Price Momentum Index?Public-source market momentum score from annual home price appreciation and the latest available quarterly metro/state trend signal.
Latest Housing Permit Activity?Latest monthly residential permit units per 1,000 occupied housing units, computed from county permit filings and exposed as a normalized activity signal.
Recent Home Price Trend?Latest public quarterly home price trend. CBSA quarterly HPI is preferred where the geography maps to a metro area, then state quarterly HPI, then latest annual appreciation.
Year-to-Date Housing Permit Activity?Year-to-date residential permit units per 1,000 occupied housing units, computed from county permit filings and exposed as a normalized activity signal.
Approx. President - Republican %?Approximate area Republican two-party presidential vote share from election-county returns allocated to app geographies by polygon overlap weights.
Approx. President - Democrat %?Approximate area Democratic two-party presidential vote share from election-county returns allocated to app geographies by polygon overlap weights.
Approx. Senate - Republican %?Approximate area Republican two-party U.S. Senate vote share from statewide returns allocated to app geographies by substate election proxy where available.
Approx. Senate - Democrat %?Approximate area Democratic two-party U.S. Senate vote share from statewide returns allocated to app geographies by substate election proxy where available.
Approx. House - Republican %?Approximate area Republican two-party U.S. House vote share from congressional district returns allocated to app geographies by polygon overlap weights.
Approx. Governor - Republican %?Approximate area Republican two-party governor vote share from election-county returns allocated to app geographies by polygon overlap weights where available, with state-only years falling back to substate election proxy or area share of state population.
Approx. Governor - Democrat %?Approximate area Democratic two-party governor vote share from election-county returns allocated to app geographies by polygon overlap weights where available, with state-only years falling back to substate election proxy or area share of state population.
Approx. Governor - Total Votes?Approximate area governor total votes from election-county returns allocated to app geographies by polygon overlap weights where available, with state-only years falling back to substate election proxy or area share of state population.
Approx. President - Total Votes?Approximate area presidential total votes from election-county returns allocated to app geographies by polygon overlap weights.
Approx. House - Democrat %?Approximate area Democratic two-party U.S. House vote share from congressional district returns allocated to app geographies by polygon overlap weights.
Approx. House - Total Votes?Approximate area U.S. House total votes from congressional district returns allocated to app geographies by polygon overlap weights.
Area Estimate (Approx) / US House (Midterm)3 attributes
Approx. Midterm House - Democrat %?Approximate area Democratic two-party midterm U.S. House vote share from congressional district returns allocated to app geographies by polygon overlap weights.
Approx. Midterm House - Republican %?Approximate area Republican two-party midterm U.S. House vote share from congressional district returns allocated to app geographies by polygon overlap weights.
Approx. Midterm House - Total Votes?Approximate area midterm U.S. House total votes from congressional district returns allocated to app geographies by polygon overlap weights.
Approx. Senate - Total Votes?Approximate area U.S. Senate total votes from statewide returns allocated to app geographies by substate election proxy where available.
Area Estimate (Approx) / US Senate (Midterm)3 attributes
Approx. Midterm Senate - Democrat %?Approximate area Democratic two-party midterm U.S. Senate vote share from statewide returns allocated to app geographies by substate election proxy where available.
Approx. Midterm Senate - Republican %?Approximate area Republican two-party midterm U.S. Senate vote share from statewide returns allocated to app geographies by substate election proxy where available.
Approx. Midterm Senate - Total Votes?Approximate area midterm U.S. Senate total votes from statewide returns allocated to app geographies by substate election proxy where available.