

Best broadband coverage by state
Ranked by the share of households with a broadband internet subscription. Pick a state for its top ZIP codes.
How we rank broadband coverage
Broadband coverage is the share of households with an internet subscription beyond dial-up, including cable, fiber, DSL, satellite, or cellular data.
It measures subscriptions, not available speeds or providers: a ZIP with fast service available can still rank lower if fewer households subscribe.
Only ZIPs with at least 1,000 residents are ranked, so a handful of households cannot top the list. 22,679 U.S. ZIPs qualify.
U.S. ZIP codes ranked by broadband coverage
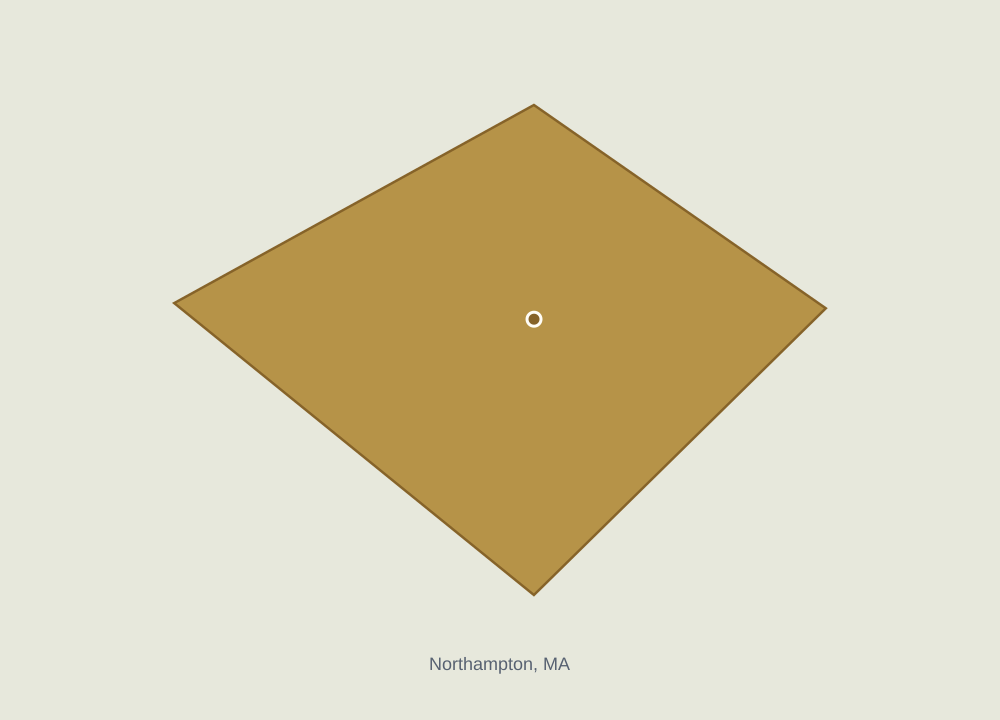 1ZIP 01063
Northampton
Massachusetts
- Households with broadband
- 100.0%
- ZIP population
- ~2k
- Avg. temperature
- 49°F
- Avg. commute
- 10 min
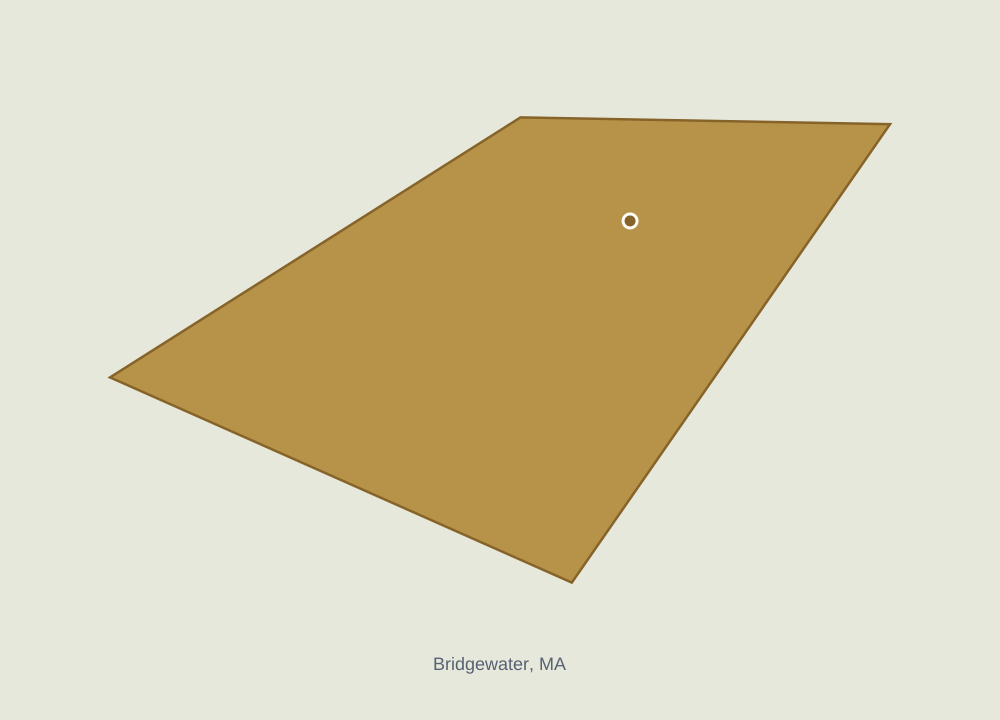 2ZIP 02325
Bridgewater
Massachusetts
- Households with broadband
- 100.0%
- ZIP population
- ~3k
- Avg. temperature
- 50°F
- Avg. commute
- 15 min
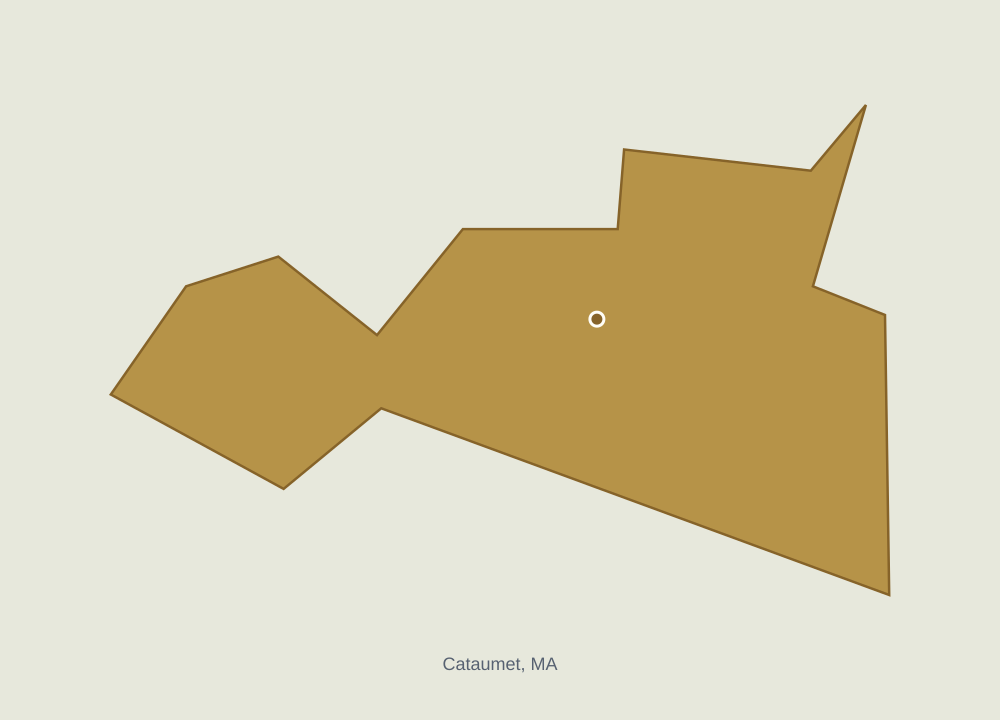 3ZIP 02534
Cataumet
Massachusetts
- Households with broadband
- 100.0%
- ZIP population
- ~1k
- Avg. temperature
- 51°F
- Avg. commute
- 23 min
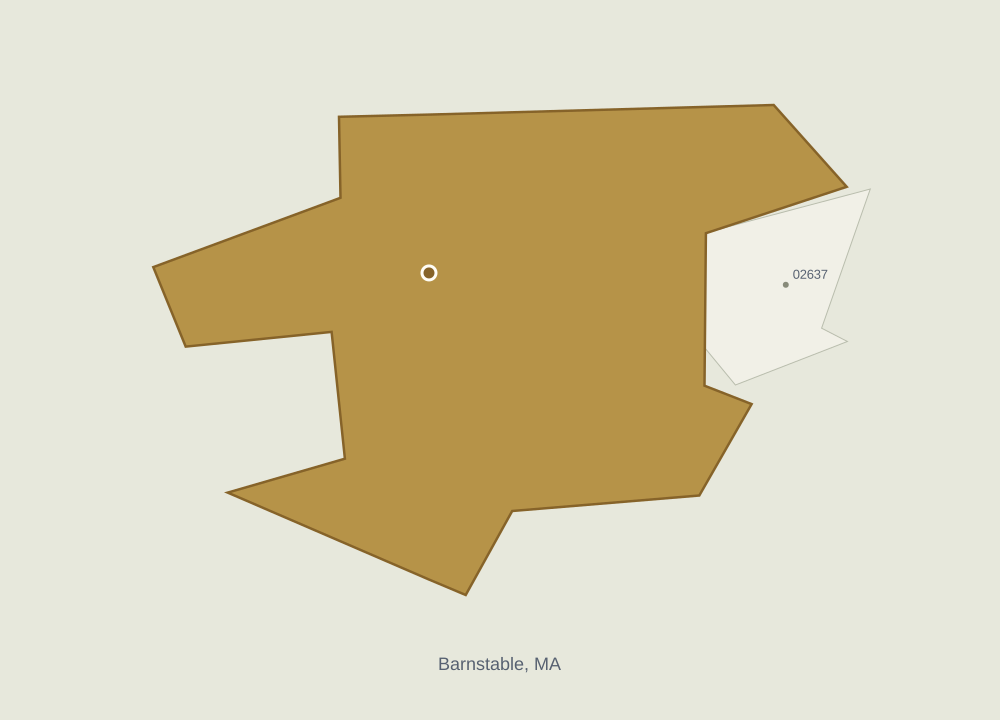 4ZIP 02630
Barnstable
Massachusetts
- Households with broadband
- 100.0%
- ZIP population
- ~2k
- Avg. temperature
- 51°F
- Avg. commute
- 23 min
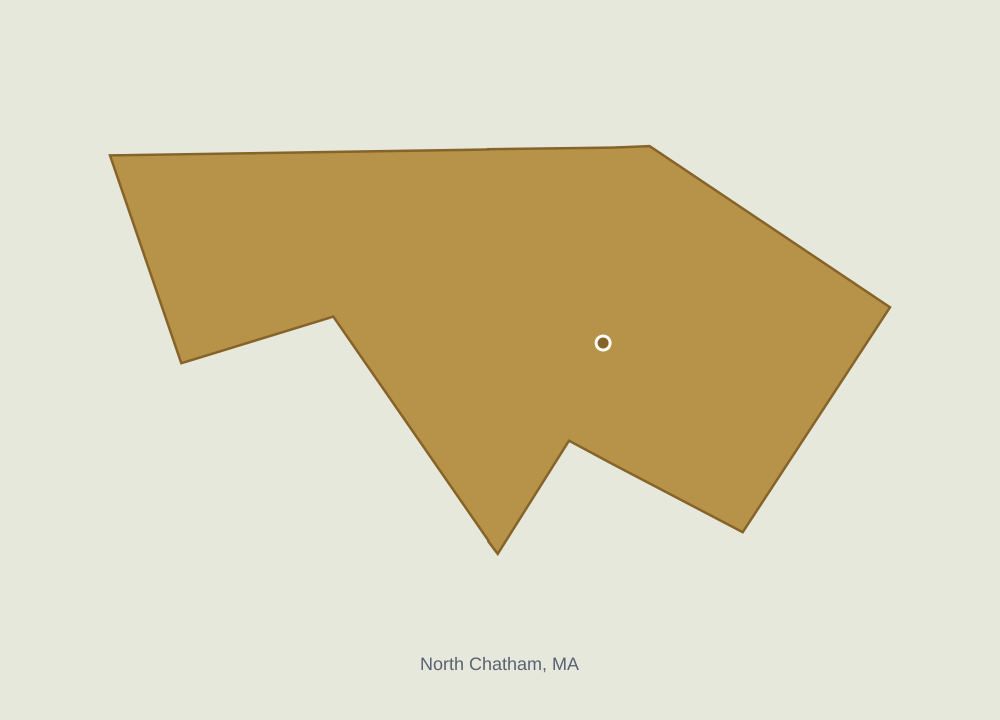 5ZIP 02650
North Chatham
Massachusetts
- Households with broadband
- 100.0%
- ZIP population
- ~1k
- Avg. temperature
- 51°F
- Avg. commute
- 33 min
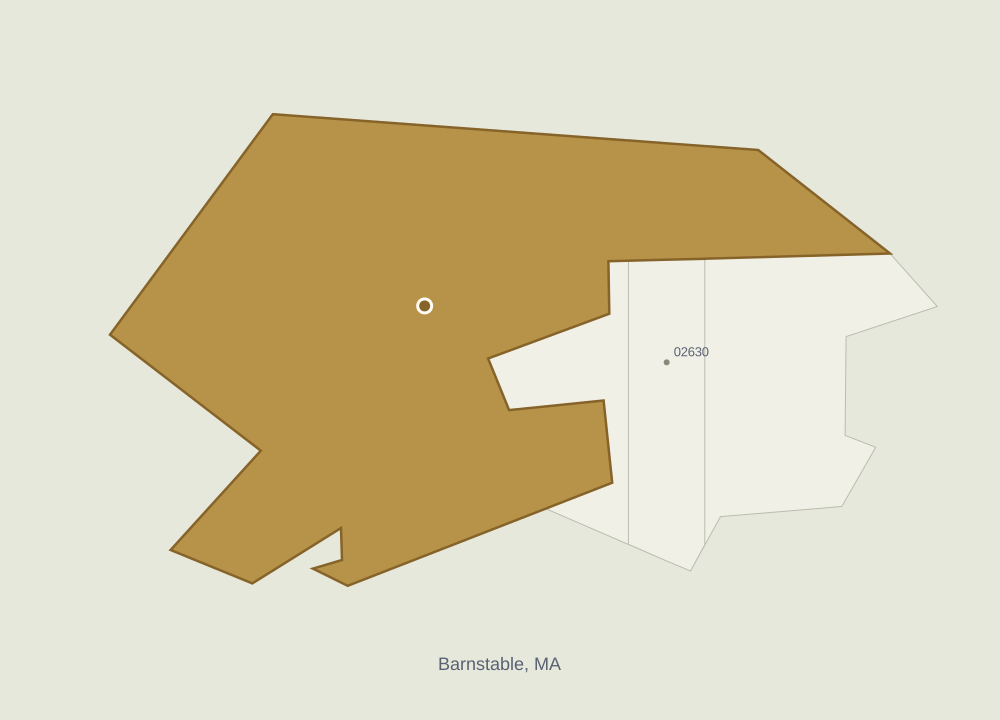 6ZIP 02668
Barnstable
Massachusetts
- Households with broadband
- 100.0%
- ZIP population
- ~3k
- Avg. temperature
- 51°F
- Avg. commute
- 20 min
| Rank | ZIP | City | State | Households with broadband |
|---|---|---|---|---|
| #7 | 02804 | Ashaway | Rhode Island | 100.0% |
| #8 | 02812 | Carolina | Rhode Island | 100.0% |
| #9 | 02841 | Newport | Rhode Island | 100.0% |
| #10 | 02898 | Wyoming | Rhode Island | 100.0% |
| #11 | 02918 | Providence | Rhode Island | 100.0% |
| #12 | 03057 | Milford | New Hampshire | 100.0% |
| #13 | 03810 | Alton | New Hampshire | 100.0% |
| #14 | 03849 | Madison | New Hampshire | 100.0% |
| #15 | 04097 | Yarmouth | Maine | 100.0% |
| #16 | 04860 | Tenants Harbor | Maine | 100.0% |
| #17 | 05405 | Burlington | Vermont | 100.0% |
| #18 | 06039 | Lakeville | Connecticut | 100.0% |
| #19 | 06090 | Granby | Connecticut | 100.0% |
| #20 | 06755 | Gaylordsville | Connecticut | 100.0% |
| #21 | 07046 | Mountain Lakes | New Jersey | 100.0% |
| #22 | 07058 | Montville | New Jersey | 100.0% |
| #23 | 07078 | Short Hills | New Jersey | 100.0% |
| #24 | 07311 | Jersey City | New Jersey | 100.0% |
| #25 | 07933 | Gillette | New Jersey | 100.0% |
Choose a state
States are shaded by their population-weighted average households with broadband across ranked ZIPs; darker is higher, and higher is better. Hover a state for its value.
- AlabamaAvg. 87.6%
- AlaskaAvg. 92.9%
- ArizonaAvg. 91.5%
- ArkansasAvg. 87.0%
- CaliforniaAvg. 93.3%
- ColoradoAvg. 93.7%
- ConnecticutAvg. 92.2%
- DelawareAvg. 92.4%
- District of ColumbiaAvg. 90.5%
- FloridaAvg. 91.7%
- GeorgiaAvg. 91.1%
- HawaiiAvg. 92.3%
- IdahoAvg. 91.9%
- IllinoisAvg. 90.9%
- IndianaAvg. 89.9%
- IowaAvg. 89.1%
- KansasAvg. 91.1%
- KentuckyAvg. 88.8%
- LouisianaAvg. 86.8%
- MaineAvg. 90.6%
- MarylandAvg. 92.6%
- MassachusettsAvg. 92.8%
- MichiganAvg. 90.7%
- MinnesotaAvg. 91.9%
- MississippiAvg. 84.3%
- MissouriAvg. 89.5%
- MontanaAvg. 89.5%
- NebraskaAvg. 91.0%
- NevadaAvg. 92.1%
- New HampshireAvg. 93.0%
- New JerseyAvg. 92.7%
- New MexicoAvg. 86.4%
- New YorkAvg. 90.8%
- North CarolinaAvg. 90.2%
- North DakotaAvg. 89.0%
- OhioAvg. 90.1%
- OklahomaAvg. 89.1%
- OregonAvg. 92.5%
- PennsylvaniaAvg. 89.7%
- Rhode IslandAvg. 91.6%
- South CarolinaAvg. 88.8%
- South DakotaAvg. 89.7%
- TennesseeAvg. 89.3%
- TexasAvg. 91.3%
- UtahAvg. 93.6%
- VermontAvg. 89.9%
- VirginiaAvg. 91.4%
- WashingtonAvg. 93.7%
- West VirginiaAvg. 86.6%
- WisconsinAvg. 90.3%
- WyomingAvg. 89.8%
Other research

Best ZIP codes for schools
Ranked by school quality index
- U.S. median ZIP
- 47.8
- Middle 80% of ZIPs
- 30.2 to 67.2

Most affordable ZIP codes
Ranked by cost of living index
- U.S. median ZIP
- 98.4
- Middle 80% of ZIPs
- 76.4 to 148.2

ZIP codes with the shortest commutes
Ranked by mean commute
- U.S. median ZIP
- 26.1 min
- Middle 80% of ZIPs
- 18.6 min to 35.1 min

Best healthcare access
Ranked by healthcare access score
- U.S. median ZIP
- 93.3
- Middle 80% of ZIPs
- 83.7 to 98.7

Warmest ZIP codes
Ranked by avg. temperature
- U.S. median ZIP
- 54.9°F
- Middle 80% of ZIPs
- 46.5°F to 68.1°F